

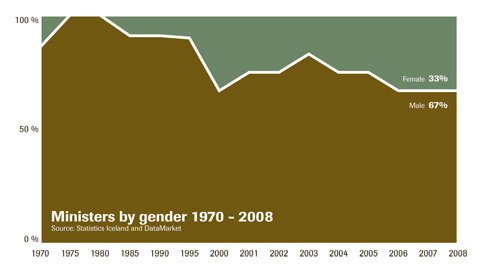
The chart above demonstrates changes between years for ministers in the Icelandic government by gender. As you can see, the late seventies was the age of man. But since 1980, the gender difference is gradually decreasing. Albeit, yes … gradually. Very gradually. Some day soon, though … It is tempting to relate the changes since 1980 to the foundation of the Women’s Party in 1983. Discussion of the participation of women in politics was one of the reasons the party was founded, and may have played a part in putting the issue in the public eye before the party was actually founded. The party first ran for elections in 1983 and there is a trend towards more female participation in government until 2000. There is surely some conspiracy theorist out there who will point out how these changes coincide with the rise of the Icelandic economic bubble, but I’m not going to do it.
Check out an interactive graph at www.datamarket.com (short link: www.url.is/3z0)
Gender Rule Statistics
/


